 Help
Help

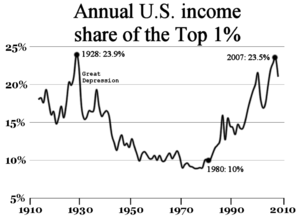
The upper 1 percent of Americans are now taking in nearly a quarter of the nation’s income every year. A number of economists argue this is extremely unhealthy. What is the reality of the situation?
Inequality What does it really mean?
#1

- Group: Advanced Members
- Posts: 17,191
- Joined: 2005-January-08
- Gender:Male
- Location:Tulsa, Oklahoma
- Interests:Art, music
Posted 2013-February-25, 15:55
"Injustice anywhere is a threat to justice everywhere." Black Lives Matter. / "I need ammunition, not a ride." Zelensky
#2
- Group: Advanced Members
- Posts: 10,611
- Joined: 2009-September-15
- Gender:Female
- Location:London
Posted 2013-February-25, 17:38
 Winstonm, on 2013-February-25, 15:55, said:
What is the reality of the situation?
The reality is that either the upper 1 percent of Americans are now taking in nearly a quarter of the nation’s income every year, or they are not. The author did not cite his source, but I think that it is reasonably safe to assume that his premise is roughly true.
I know not with what weapons World War III will be fought, but World War IV will be fought with sticks and stones -- Albert Einstein
#3
- Group: Advanced Members
- Posts: 16,739
- Joined: 2003-October-07
- Gender:Male
Posted 2013-February-25, 18:18
Winstonm, on 2013-February-25, 15:55, said:
The upper 1 percent of Americans are now taking in nearly a quarter of the nation’s income every year. A number of economists argue this is extremely unhealthy. What is the reality of the situation?
"The top 1 percent have the best houses, the best educations, the best doctors, and the best lifestyles, but there is one thing that money doesn’t seem to have bought: an understanding that their fate is bound up with how the other 99 percent live. Throughout history, this is something that the top 1 percent eventually do learn. Too late"
Too late for what? The author does not tell us. I cant find any specific recommendation to fix inequality.
If this cannot continue then it won't.
But it does seem pretty wierd if the top 13% took in the 33% 25 years ago and today 1% TAKE in 25% and control 40%.
Anyway one recommendation I would make it to make sure that risk stays with the capitalist and not the taxpayer. If a company becomes too big to fail then dont bail it out, have the govt take it over and place severe limits on the new management's total compensation, say 400K/person.
The goal being to better aline reward and risk and at least take one step towards ending crony capitalism and govt picking favorites.
A larger overall goal would be to start to reward the risk taker, to create or at least encourage a culture of risk taking even those that fail and most will fail, often.
#4
- Group: Advanced Members
- Posts: 11,052
- Joined: 2004-September-22
- Location:Northern Maryland
Posted 2013-February-25, 18:35
A few years back a reporter asked a member of the state legislature if his work in promoting a certain bill was not a conflict of interest. The legislator replied that he didn't think that it conflicted with his interests at all.
The article is rather general. Here is a specific that I have harped on before. In 1956 I began my studies at the University of Minnesota. Tuition was approximately $230 per year. Minimum wage was a dollar an hour. So six weeks of work at minimum wage would pay a year's tuition. Now, at Maryland, a year's tuition is somewhat over $8,000. Minimum wage is under $8 per hour. So it takes more than six months to earn tuition for a year.
This is not good.
Having so much wealth, and especially so much power, concentrated in so few hands is definitely a problem, no doubt about it. But I don't think it really moves people all that much. The vanishing of opportunity will move people, however. A guy can be happy without a yacht, but he wants his kids to be able to afford college.
Ken
#5
- Group: Advanced Members
- Posts: 6,496
- Joined: 2006-February-24
Posted 2013-February-25, 21:05

Source: CBO via Krugman
Quote
Loss of income by the middle class relative to the top earning 1% and 0.1% is both a cause and effect of political change according to journalist Hedrick Smith. In the decade starting around 2000, business groups employed 30 times as many Washington lobbyists as trade unions and 16 times as many lobbyists as labor, consumer, and public interest lobbyists combined.[246]
From 1998 through 2010 business interests and trade groups spent $28.6 billion on lobbying compared with $492 million for labor, nearly a 60-to-1 business advantage.[247]
The result, according to Smith, is a political landscape dominated in the 1990s and oughts by business groups, specifically "political insiders" — former members of Congress and government officials with an inside track — working for "Wall Street banks, the oil, defense, and pharmaceutical industries; and business trade associations.
Source: Wikipedia
If you lose all hope, you can always find it again -- Richard Ford in The Sportswriter
#6
- Group: Advanced Members
- Posts: 17,191
- Joined: 2005-January-08
- Gender:Male
- Location:Tulsa, Oklahoma
- Interests:Art, music
Posted 2013-February-25, 23:14
There are arguments being made that inequality contributed to both the Great Depression and the Great Recession.
"Injustice anywhere is a threat to justice everywhere." Black Lives Matter. / "I need ammunition, not a ride." Zelensky
#7
- Group: Advanced Members
- Posts: 6,496
- Joined: 2006-February-24
Posted 2013-February-26, 07:20
Of course, correlation is not causation. Just sayin'.
If you lose all hope, you can always find it again -- Richard Ford in The Sportswriter
#8
- Group: Advanced Members
- Posts: 11,052
- Joined: 2004-September-22
- Location:Northern Maryland
Posted 2013-February-26, 07:25
I had trouble understanding the Krugman grpahic so I went to the CBO link http://www.cbo.gov/publication/42729. Better, but still a problem. They link to a larger pdf,
http://www.cbo.gov/s...eholdIncome.pdf,
which has some definitions:
I have not yet made up my mind about the square roots. We are a household of 2, so our income, for their purposes, will be our actual income divided by the square root of 2. A household with two adults and two children will have their income divided by 2.
The CBO report says that
These figures apparently are inflation adjusted. I was surprised to find that the lowest quintile actually had an increase in income of 18% during that period. But of course maybe they didn't. Maybe they just had fewer children, so this square root adjustment kicks in to record them as having higher income.
I am trying to cope with these figures.
As it happens, I was having some sort of economic discussion with a friend over the weekend, and the subject of long term inflation came up. So I checked out the BLS calculator at
http://www.bls.gov/d..._calculator.htm
It tells me that $100 in 1956 will buy the same amount as $846.82 does today. I expected the inflation figure to be higher. Minimum wage, in 1956,was, $1.00. Today it is $7.25. To keep pace with inflation it should be $8.47. So it is low, but not as totally out of whack as I had believed.
I am trying hard to get a grasp on what is real and what is not. The article Winston cites appears to blame the rich for the fact that many people spend beyond their means. Sorry, but I know some of these people and they act like fools. Their foolish behavior is not due to Bill Gates being rich.
I worry that people at the bottom don't have enough, even if they are careful. If their income is truly rising, that worry might be misplaced even if the rivh are rivher than they used to be. But I am far from sure that they really do have more income than before.
And I worry that pronounced concentration of wealth leads to pronounced concentration of power.I don't really care who owns a private jet, but I do care if a small group of people can largely determine the fate of the nation without being held at all accountable.
An I still don't get it with this square root stuff.
http://www.cbo.gov/s...eholdIncome.pdf,
which has some definitions:
Quote
Income is adjusted for inflation using the Bureau of Labor Statistics' research series of the consumer price index for all urban consumers (CPI-U-RS). Income is adjusted for differences in household size—specifically, by dividing income by the square root of a household's size. (A household consists of the people who share a housing unit, regardless of their relationships.)Income categories are defined by ranking all households by their size-adjusted income. Per-centiles (hundredths) and quintiles (fifths) contain equal numbers of people. Households with negative income are excluded from the lowest income category but are included in totals.
I have not yet made up my mind about the square roots. We are a household of 2, so our income, for their purposes, will be our actual income divided by the square root of 2. A household with two adults and two children will have their income divided by 2.
The CBO report says that
Quote
CBO finds that, between 1979 and 2007, income grew by:
- 275 percent for the top 1 percent of households,
- 65 percent for the next 19 percent,
- Just under 40 percent for the next 60 percent, and
- 18 percent for the bottom 20 percent.
These figures apparently are inflation adjusted. I was surprised to find that the lowest quintile actually had an increase in income of 18% during that period. But of course maybe they didn't. Maybe they just had fewer children, so this square root adjustment kicks in to record them as having higher income.
I am trying to cope with these figures.
As it happens, I was having some sort of economic discussion with a friend over the weekend, and the subject of long term inflation came up. So I checked out the BLS calculator at
http://www.bls.gov/d..._calculator.htm
It tells me that $100 in 1956 will buy the same amount as $846.82 does today. I expected the inflation figure to be higher. Minimum wage, in 1956,was, $1.00. Today it is $7.25. To keep pace with inflation it should be $8.47. So it is low, but not as totally out of whack as I had believed.
I am trying hard to get a grasp on what is real and what is not. The article Winston cites appears to blame the rich for the fact that many people spend beyond their means. Sorry, but I know some of these people and they act like fools. Their foolish behavior is not due to Bill Gates being rich.
I worry that people at the bottom don't have enough, even if they are careful. If their income is truly rising, that worry might be misplaced even if the rivh are rivher than they used to be. But I am far from sure that they really do have more income than before.
And I worry that pronounced concentration of wealth leads to pronounced concentration of power.I don't really care who owns a private jet, but I do care if a small group of people can largely determine the fate of the nation without being held at all accountable.
An I still don't get it with this square root stuff.
Ken
#9
- The Abbess
-

- Group: Advanced Members
- Posts: 17,080
- Joined: 2004-April-22
- Gender:Female
- Location:UK
Posted 2013-February-26, 07:43
I think it is a really bad thing. If we could somehow magically increase the market value of unskilled labour, it would have many positive effects.
Globalization and technological progress may be partly to blame but I am not sure if it is very useful to know if/that there is such a causation. Few people would argue policies aimed at halting globalization and technological progress, for various reasons.
Globalization and technological progress may be partly to blame but I am not sure if it is very useful to know if/that there is such a causation. Few people would argue policies aimed at halting globalization and technological progress, for various reasons.
The world would be such a happy place, if only everyone played Acol :) --- TramTicket
#10
- Group: Advanced Members
- Posts: 1,627
- Joined: 2009-November-30
- Location:Oxfordshire, England
Posted 2013-February-26, 08:12
kenberg, on 2013-February-26, 07:25, said:
An I still don't get it with this square root stuff.
If you are trying to compare the incomes of different households - and particularly if you want to define which households are in which percentile of the income distribution - it makes sense to make some allowance for the size of the household. The larger the household, the larger the income they need to reach the same standard of living. But how much extra income? A household of two needs more income than a household of one, but not twice as much. Using the square root of the household size is, I think, just a convenient way of reflecting this. (This process of adjusting household incomes for household size is known in the UK as "equivalisation" - even though that sounds a very un-English word! I don't know if this is also the term used in the US, though.)
#11
- Group: Advanced Members
- Posts: 11,052
- Joined: 2004-September-22
- Location:Northern Maryland
Posted 2013-February-26, 08:55
Sure, and as long as it is clear that this is being done it is, perhaps, ok. But you do end up with the possibility that data showing that the household income has increased really reflects the fact that the number of kids per household has decreased.
We would all know that households with more people would require more money. But it might be clearer if income per household were just reported as income per household, and then other figures were kept about the change in household size. Specifically, I was surprised to find that income of the lowest quintile had increased 18%. Thanks to this adjustment, I have no idea whether that increase is due to the adults being paid 18% more, or the family size shrinking in some way that produced this number. If we are to speak of addressing a problem, it could be useful to know which explanation is the correct one. If either.
I haven't read the pdf file yet, so maybe the info is there. I don't dispute that scaling income for household size has its uses, but it also combines two disparate numbers into one, and that can make the resulting number more difficult to use productively.
Ken
#12
- Group: Admin
- Posts: 21,412
- Joined: 2004-August-21
- Gender:Male
Posted 2013-February-26, 10:24
kenberg, on 2013-February-26, 08:55, said:
Sure, and as long as it is clear that this is being done it is, perhaps, ok. But you do end up with the possibility that data showing that the household income has increased really reflects the fact that the number of kids per household has decreased.
Indeed, US household size has been decreasing. There's a graph of the past 80 years here, and it's now about 72% of what it was in 1930. But the trend also has reversed in the past decade -- the poor economy has resulted in more adult children moving back home.
Note that "household size" is not just dependent on the number of children a couple has. It also reflects whether extended families live together. A century ago there were probably more elderly parents moving in with their children, and now we have more adult children moving in with their parents.
But isn't the point of taking the square root intended to reduce the impact of this? It's a compromise between calculating per-capital and per-household income.
Note also that the number of two-income households has increased significantly over the past few decades.
#13
- Group: Advanced Members
- Posts: 11,052
- Joined: 2004-September-22
- Location:Northern Maryland
Posted 2013-February-26, 10:54
As long as I know they are dividing by the square root of household size, it's probably harmless. I hope they publish the raw data somewhere.
I do realize, sort of, why they do it. But to me it has the odor of made up significance. Yes, it is not just the number of children. Imo, a house hold with three adults is a lot different from a household with two adults and one child, and that again is different from a household with a single parent and two children. No need to detail why it is different, at least not for anyone who has had children. In eaxh case, the household raw income is divided by 1.739 or so.
So my history with this was that first, on the CBO page, i saw this 18%. I thought "Huh! Wouldn't have believed it. They don't say, but adjusted for inflation no doubt". I go to the pdf. They have definitions. Yep. Adjusted for inflation. Then I see this square root stuff. Then I ask myself "What decision would I make, based on the fact that the raw household income, divided by the square root of the household size, has gone up 18%?" I couldn't think of any.
Also, rich people, by and large, have fewer kids. So part of this horrific figure that 1% of the population gets 50+% of the income is in fact not at all what it appears to be. This has political consequences. You (not you personally) whip up great concern over this 1% versus 50% and everyone says OMG. Then someone says, well really, it's not so much that they bring in 50%, rather it's that they have fewer kids, and when you divide by the square root, blah blah, .... No one is listening.. A good part of your audience went out for a beer as soon as square roots were mentioned.
We have problems and they should be addressed. It will work best if no one gets too cute. People get the point when Warren Buffet says his secretary pays a lower tax rate than he does. If someone starts talking about Warren Buffet's income divided by the square root of his household size, I doubt that many are listening. And they surely are not listening when someone says that irresponsible financial behavior by others is caused by this square root.
Anyway, I got nothin against them square roots, I am prepared to move on.
Ken
#14
- Group: Advanced Members
- Posts: 1,627
- Joined: 2009-November-30
- Location:Oxfordshire, England
Posted 2013-February-26, 11:07
kenberg, on 2013-February-26, 10:54, said:
... it is not just the number of children. Imo, a house hold with three adults is a lot different from a household with two adults and one child, and that again is different from a household with a single parent and two children....
Certainly a fair point, and I did wonder whether to go into the subject a bit more in my earlier post. When I remember seeing this sort of stuff in the UK (the best part of 20 years ago, I fear) it was not simply based on square roots. There were specific "equivalisation" factors for different types of households depending not just on numbers of adults and children, but also, I think, age groups of children. So, while a second adult might add, say, 0.6 to the denominator used to divide the household income, a child aged 15-17 might add 0.5 and one aged 0-5 might add 0.3 (or whatever - I've just made up all those numbers since I certainly can't remember them). This sounds to me a bit less misleading than simply using a square root.
I see all this stuff as being of use in the first instance for comparing the incomes of different households at a given point in time, and I can see that one might want to be a bit more careful in using it to compare incomes across time, which I think is your main concern. But I still think it is likely to be less misleading than not equivalising.
Edit: Sorry, your last sentence didn't register. I'll leave the above in my post in case anyone finds it useful, but feel free to ignore it!
#15
- 2011 Poster of The Year winner
-
- Group: Advanced Members
- Posts: 6,002
- Joined: 2010-July-08
- Gender:Male
#16
- Group: Admin
- Posts: 21,412
- Joined: 2004-August-21
- Gender:Male
Posted 2013-February-27, 10:27
kenberg, on 2013-February-26, 10:54, said:
As long as I know they are dividing by the square root of household size, it's probably harmless. I hope they publish the raw data somewhere.
I do realize, sort of, why they do it. But to me it has the odor of made up significance. Yes, it is not just the number of children. Imo, a house hold with three adults is a lot different from a household with two adults and one child, and that again is different from a household with a single parent and two children. No need to detail why it is different, at least not for anyone who has had children. In eaxh case, the household raw income is divided by 1.739 or so.=
I do realize, sort of, why they do it. But to me it has the odor of made up significance. Yes, it is not just the number of children. Imo, a house hold with three adults is a lot different from a household with two adults and one child, and that again is different from a household with a single parent and two children. No need to detail why it is different, at least not for anyone who has had children. In eaxh case, the household raw income is divided by 1.739 or so.=
Statistics, by their very nature, remove lots of details. In this case, I guess the assumption is that these differences mostly cancel each other out, so treating them as equivalent doesn't make the statistics too misleading.
I find it curious that they chose the square root rather than the logarithm -- the latter seems to be the more common way to flatten out numbers like this.
I've got "Naked Statistics" on my Kindle, but haven't started reading it yet (except part of the free preview before I bought). Maybe it will address stuff like this.
#17
- Group: Advanced Members
- Posts: 11,052
- Joined: 2004-September-22
- Location:Northern Maryland
Posted 2013-February-28, 06:23
With any metric, there are intended applications and then there are other applications. Let's begin with an absurd hypotthetical application. Suppose I am married and have two children living at home. Suppose I am self-employed and make $100,000. Tax time comes and I report my income as $50,000 and send in taxes based on that amount. The IRS asks what happened to the other 50K and I explain that I am using the CBO definition of income so I divided 100 by the square root of 4. It's an idea, but probably not a good one.
But now go back to the Krugman blog, posted earlier. Nowhere in this blog does Krugman explain that the word "ibncome" is being used in a technical manner that is significantly different from the meaning that most people understand. This will cost him. People expect common words to mean what they think they mean, and most people think income means how much money you make, they do not think that any division by the square root of anything \is involved. .
Diving by the square root of household size may o\r may not be a good idea for the CBO's purposes. My option is that it is not a good idea, but I'm not the CBO. I am sure, however, that it is a very bad idea to use such figures to advocate a social/political position without explaining that the words are being used in an unexpected way. An alert is required.
Ken
#18
- The Abbess
-
- Group: Advanced Members
- Posts: 17,080
- Joined: 2004-April-22
- Gender:Female
- Location:UK
Posted 2013-February-28, 07:05
How much must a four-person household earn to have the same standard of living as a single who earns 20 k? Maybe someone did some research and found the squareroot to work better than the alternatives .
Blanket statements like "per capita disposable income is 10% higher in xland than in yland " always make me wonder what exactly it means. It is obvious that there is no such thing as "raw data" that would give any meaningful comparison so lots of adjustments must have been made. Household size is just one of many issues . You should expect to be a little puzzled when reading the small print.
Blanket statements like "per capita disposable income is 10% higher in xland than in yland " always make me wonder what exactly it means. It is obvious that there is no such thing as "raw data" that would give any meaningful comparison so lots of adjustments must have been made. Household size is just one of many issues . You should expect to be a little puzzled when reading the small print.
The world would be such a happy place, if only everyone played Acol :) --- TramTicket
#19
- Group: Advanced Members
- Posts: 11,052
- Joined: 2004-September-22
- Location:Northern Maryland
Posted 2013-February-28, 07:42
Here is an example with some basis in observation. I will (slightly) disguise jurisdictions by using letters. The University I was at for many years is in county A. County B is fairly nearby, but commuting is tough. County B has a fine school system, count A has a poor school system. Many, very many, faculty members I knew over the years lived in county A when they first arrived. As soon as they had kids, they moved to county B. Prices change over the years, but at current prices I would estimate that a nice but modest house on a modest bit of land costs about 300K more in county B than it does in county A. Actually, it of course depends on just where you live in county A and county B. For example, Sergei Brin of Google fame grew up in county A. So it is not all about counties, but it is a lot about where the house is. This is a one time expense when the first child is born, there is no need to move again when the second child is born. Of course the house is an investment as well as an expense, but a family has to have the money and the income to do it.
Here is another example of a different sort. A friend's grandchildren live in county B, near one of the good schools. His daughter wanted her kids to go to a classy private school. I honestly don't get it, but they did not consult me. Now in this case the (substantial) increase in cost is directly proportional to the number of children. The tuition for x children is kx. He is (willingly I guess) going along with this, helping out. As with the house price, the amount involved is substantial, swamping anything related to clothes or food. No square roots, no logs.
A long time back I had a summer job working for a company doing some mathematical modeling. The model, in a word, was stupid. We got paid to do it anyway. I would hope no one ever made any decisions based on the model.
This square root model looks like such a case.
Ken
#20
- Group: Advanced Members
- Posts: 16,739
- Joined: 2003-October-07
- Gender:Male
Posted 2013-February-28, 09:58
Hope this point is on topic.
The one percent of the one percent of the population is vastly more sensitive to inequality than total GDP growth (which explains why the
superrich are doing well now, and should do better under globalization, and why it is a segment that doesn’t correlate well with the economy).
For the super-rich, one point of GINI causes an increase equivalent to 6-10% increase in total income (say, GDP). More generally, the partial
expectation in the tail is vastly more sensitive to changes in scale of the distribution than in its centering
---------------
---------------
The Gini coefficient measures the inequality among values of a frequency distribution (for example levels of income). A Gini
http://en.wikipedia....ini_coefficient
=================================
the money of the superrich reacts to inequality rather than total wealth in the world, wealth multiplies by close to 50 times in response to a change of 25% in dispersion of wealth. it has nothing to do with growth and total wealth formation.